


The sources of our emissions
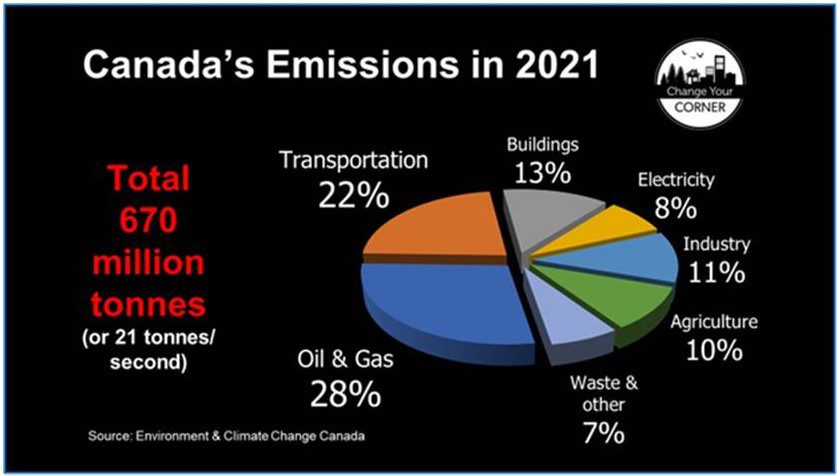
Here’s a graphic worth sharing and putting on your fridge: a chart of Canada’s greenhouse gas emissions in 2021.

Here are brief explanations of each slice:
Oil & gas: emissions from the extraction, transportation and refining of fossil fuels (but not the burning). Most of this slice is from the Alberta oil sands, and it’s the main reason why, on a per capita basis, Alberta has about six times the emissions of Ontario or Quebec.
Transportation: emissions from fossil fuels burned by ships, planes, trains, buses, trucks and cars. Fully one-third of Canadian transportation emissions are generated by pickup trucks and SUVs.
Buildings: emissions from the burning of heating oil and natural gas.
Electricity: emissions from the burning of oil, coal and natural gas for the production of electricity. A relatively small slice thanks to the abundance of hydro power across Canada.
Industry: emissions from mining, smelting and the manufacture of steel, cement, paper, fertilizers and other chemicals. Cement in particular has a huge carbon footprint.
Agriculture: emissions from the application of manure and fertilizer; decomposition of organic matter; livestock; and on-farm fuel use.
Waste and other: includes methane from landfills plus emissions from light manufacturing, construction and forestry operations.
(Check out the numbers and drill deeper here.)
A few key takeaways:
- Canada’s 2030 emission target is 443 million tonnes, or 40% below our 2005 emission levels. We’re currently at 670 million tonnes, or 10% below 2005 – so we have a long way to go in the next seven years.
- At the risk of stating the obvious, the biggest emission reduction potential lies in the biggest slices of the chart above. Oil & Gas and Transportation make up fully half of Canada’s emissions. Clearly, we can’t recycle ourselves out of the situation we’ve created.
- Ironically, reducing emissions from Transportation simultaneously reduces the need for oil, thus reducing two slices at once. That’s why driving less, carpooling, taking public transit, walking or biking and choosing an EV or other efficient vehicle – actions any of us can take right now – are so important and impactful.
If you follow the news, you can’t miss noticing that the planet is sending us some pretty strong signals this summer – suggesting current emission reduction targets aren’t nearly strong enough to prevent the worst of climate change.
So please do what you can to reduce every slice of Canada’s emission pie chart – but especially those huge slices, Transportation and Oil & Gas. And please share the above chart as widely as you can.
This story was brought to Nouzie by RSS. The original post can be found on https://carlsgreenideas.wordpress.com/2023/07/11/energy-literacy-2-canadas-carbon-footprint-by-sector/
